LiDAR Point Clouds: Basics for 3D Mapping by Yellowscan

This article explains what LiDAR point clouds are and how they are used. You will learn how they are collected, what data is stored inside a point cloud, and how to visualize them. Finally, you’ll learn how point cloud data is managed and processed so that it can be used for various applications.
Defining a LiDAR point cloud
It is a collection of points generated by a sensor. Such collections can be very dense and contain billions of points, which enables the creation of highly detailed 3D representations of an area. They are used in applications such as environmental monitoring, mapping, urban planning, infrastructure monitoring, and more.
Point clouds are a specific kind of point cloud: they are generated using laser pulses to measure distances to objects and create 3D representations of the environment. These laser pulses originate from a LiDAR device (also known as a 3D laser scanner). For more info on how LiDAR works, refer to this article. Learn more about how LiDAR scanners work in this article.
Other types of point clouds that are generated using different technologies and methods include photogrammetric, sonar, and radar, among others.
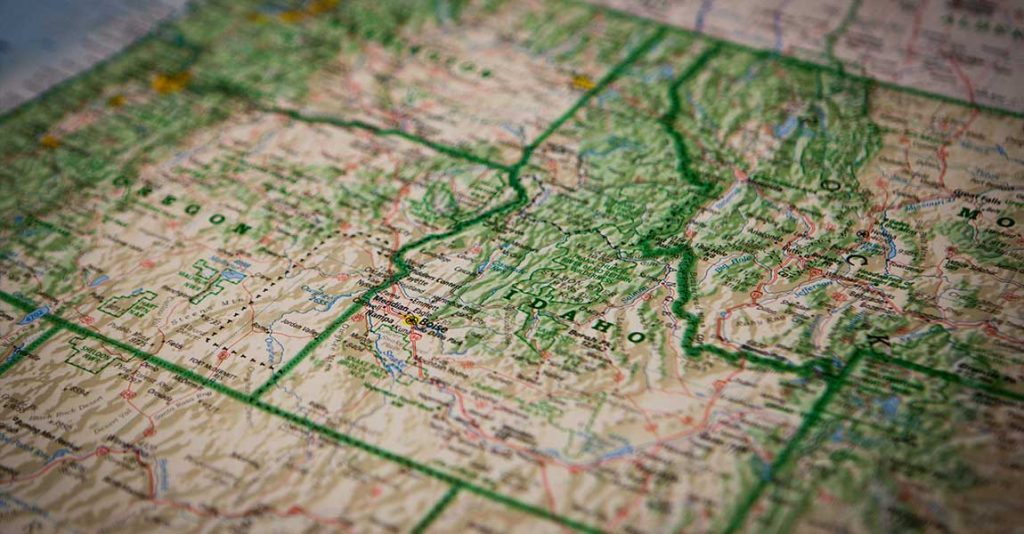
Point clouds are used for topographic mapping applications. (Source: www.pexels.com)
The benefits of LiDAR point clouds
They offer multiple benefits for different industries:
- They precisely display where objects and structures are located inside the environment. Such high-accuracy 3D data is required for surveying, mapping, and engineering applications.
- Because the data is captured in 3D, they can facilitate 3D visualization and analysis of the surveyed environment, for example for the creation of a digital twin.
- They contain rich geometric information, which facilitates detailed analysis and modeling of terrain, infrastructure, and natural features.
- They enable automated object recognition and classification so that features such as buildings, roads, and infrastructure can be identified and categorized.
A unique characteristic of LiDAR technology is that a single emitted laser pulse can have multiple returns when it encounters and interacts with multiple surfaces along its path. Based on the order of detection, a LiDAR system can distinguish between different types of returns.
Such multiple returns provide valuable information about the structure, composition, and topography of the surveyed environment which is relevant for applications such as forestry, vegetation mapping, and terrain modeling.
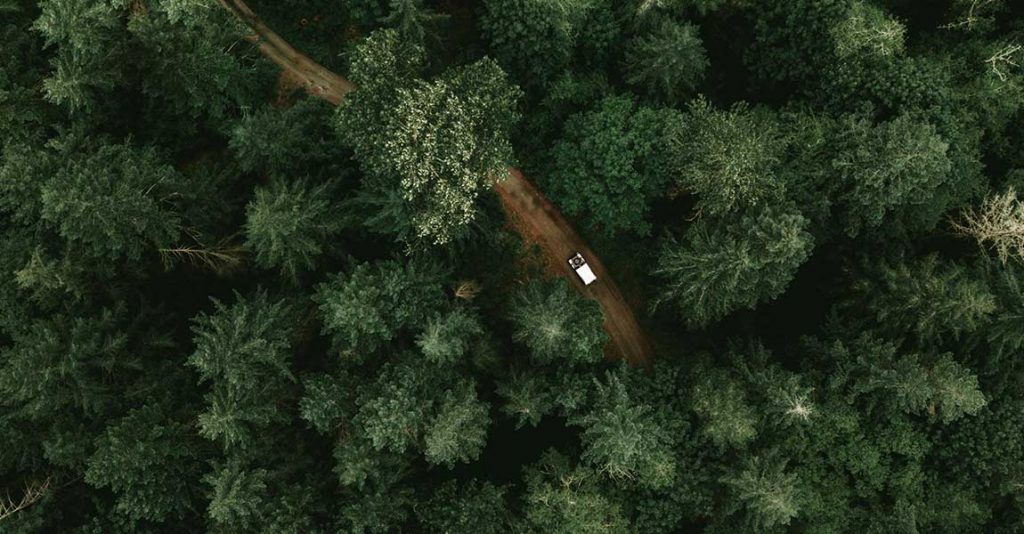
Point clouds provide relevant information for forestry applications. (Source: www.pexels.com)
What information is stored in a LiDAR point?
Point clouds provide valuable location data for different applications. To better understand their popularity and benefits, let’s take a moment to discuss the data they contain. Next, we’ll discuss how they are captured, stored, processed, and visualized, before they can be transformed into useful 3D products for different applications.
Individual points in a point cloud contain information such as 3D coordinates (X, Y, and Z), but that’s not all: along with the coordinates, the strength of the laser return signal is captured. This is valuable information that tells us more about the density of the object or the material composition.
If a classification scheme is used for a scan, it’s possible to group individual points in different classes based on the individual classification labels that represent different objects or characteristics. Here’s below an example showing all individual points inside a point cloud belonging to a single class that represents the ground or surface (shown in brown), while the rest of the points are displayed in grey.
Additionally, individual points may contain additional attributes such as the return number, scan angle, scan direction, point density, RGB color values, and time stamps. Here’s an example of the same data as in the previous image, this time using RGB values as the main symbology class:
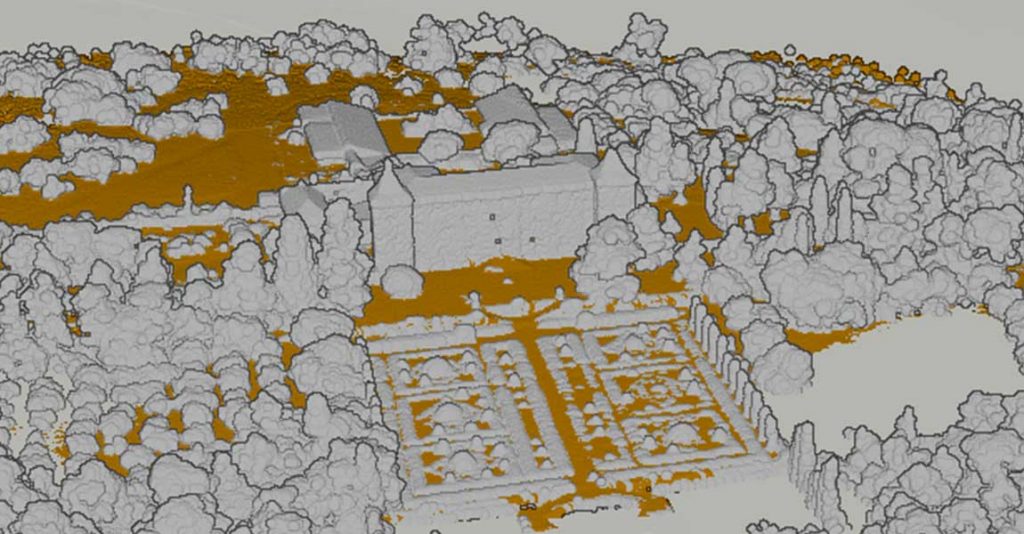
A point cloud visualization using classification for “ground” class
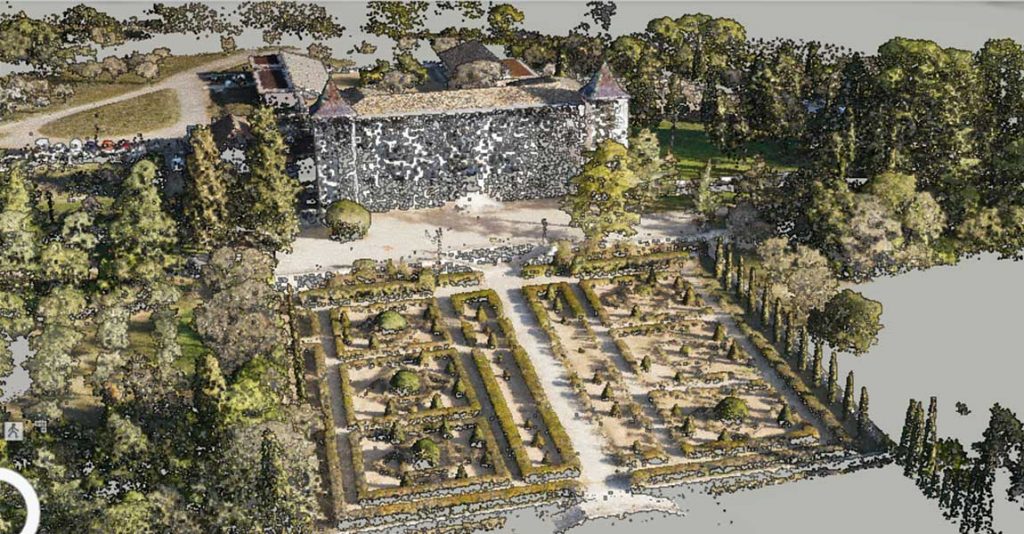
A LiDAR point cloud visualization using RGB values as the main symbology class
Different types of LiDAR scanning systems
Now let’s focus on how they are captured. There are different types of LiDAR scanning systems for generating point clouds. Usually, a distinction is made between airborne and terrestrial scanning:
- Airborne laser scanning uses manned airplanes to map large areas from a great height, whereas drone-based systems capture smaller areas closer to the ground. Learn more about drone-based LiDAR in this article.
- Terrestrial laser scanning deploys static laser scanners to capture an area, while mobile scanning uses a moving device (such as a car or train) to capture larger areas by moving a scanning device around while capturing a 3D point cloud.
These different types of scanning systems are used for different applications. However, the process for generating data is similar for each one. This is explained next.

YellowScan Navigator LiDAR system mounted on Hexadrone Tundra UAV
How LiDAR point clouds are generated
Time-of-flight LiDAR scanners are equipped with sensors that emit large volumes of laser pulses. When laser pulses encounter objects or surfaces in the environment, they reflect off these in different directions. The reflected laser pulses are detected by the sensor, which calculates the distance between the sensor and the object that reflects the pulse by using the speed of light and the time it takes for each pulse to return to the sensor.
Next, the measured distances are used to compute 3D coordinates for each point. A single point cloud is a collection of all individual points that represent the geometry and spatial distribution of objects in the scan area. In the case of a moving scanning platform, an onboard GNSS and inertial measurement unit (IMU) system records additional information to track the position and orientation of the scanning platform. This is required for direct georeferencing the captured data.
When a static, terrestrial laser scanner is used to scan the environment, multiple scans may be required from different positions or viewpoints to capture large objects and structures. A single point cloud data set can contain multiple scans from different viewpoints. These can all be visualized in a single point cloud by using a single spatial reference system.
LiDAR point cloud file formats
They can be stored in a variety of file formats, including LAS, LAZ, or E57. LAS is one of the most widely used formats for storing data, while LAZ is a compressed version of the LAS format. This allows for significant file size reduction while preserving data accuracy. E57 is a vendor-neutral file format for storing 3D imaging data, including point cloud data. Point clouds may be stored locally, on a network, or in the cloud.
Different ways to visualize point clouds
We’ve seen that they contain 3D points in space and additional data about what these points represent. Next, they can be visualized using specialized software tools including GIS, visualization software, and 3D modeling and CAD software. In addition to software-based solutions, They can also be visualized directly in web browsers through web-based applications or using AR/VR technology that allows users to immersive themselves in a 3D environment and interact with the data.
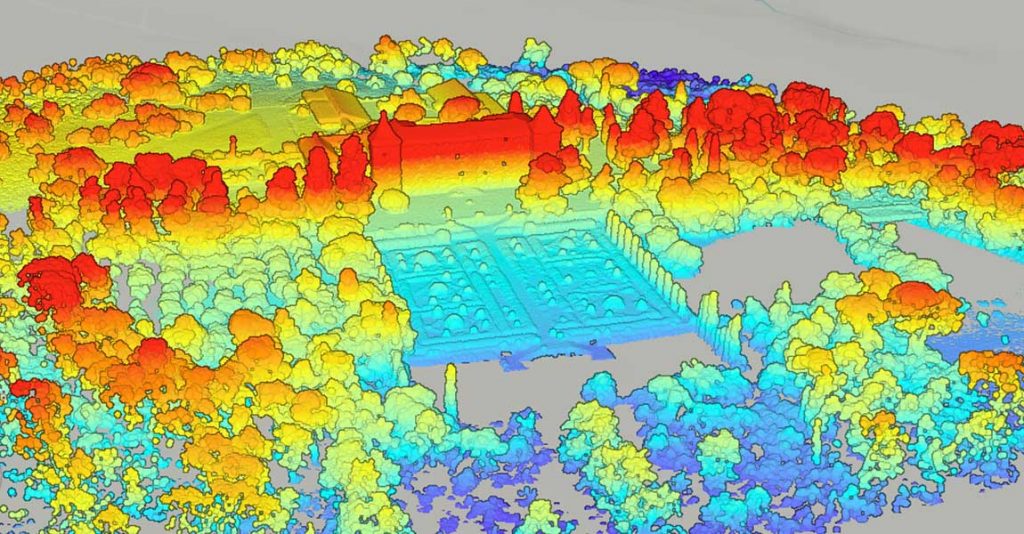
An LAS file visualized in ArcGIS Pro based on elevation values (data source: YellowScan)
Specialized software for further data management tasks
While visualizing a point cloud may be sufficient for inspection purposes, specialized software is required to perform different tasks on raw data such as data processing, filtering, segmentation, analysis, and feature extraction, among others. These are some of the tasks that are often performed on raw point clouds:
- Performing post-processing operations to enhance the quality, accuracy, and usability. This may include removing noise or outliers, and filtering or classifying points into different object classes or categories.
- Combining point clouds with other data sources to enrich the data for analysis and visualization.
- Extraction of relevant features inside a point cloud using object recognition algorithms.
These and other steps are required before different 3D products can be generated for various industry applications. Such point cloud-derived products include 3D city models, DEM/DSMs, contour lines, cross sections, break lines, and more.
Streamlining the entire data processing workflow
YellowScan CloudStation is a software solution that provides a comprehensive platform for processing, visualizing, and sharing data captured by YellowScan’s UAV LiDAR systems. By streamlining the data processing workflow from data import and processing to visualization and analysis, users can extract actionable insights and make informed decisions from UAV LiDAR survey data.
Key features include automated data processing, feature extraction and classification. Additionally, CloudStation facilitates collaboration and data sharing among stakeholders. It also provides LAS files exports, enabling users to seamlessly transfer data and derived products for further analysis, visualization, and integration into existing workflows.
The CloudStation is available in three different bundles:
- Essential: Visualize, inspect, colorize from orthophotos, and export your data.
- Pro: Visualize, inspect, refine your data quality, enrich your data with classification and color, and unlock more export features.
- Ultimate: Zero compromise, all features activated. Includes Orthophoto generation and Command Line (ytk) processing for automation & batching.
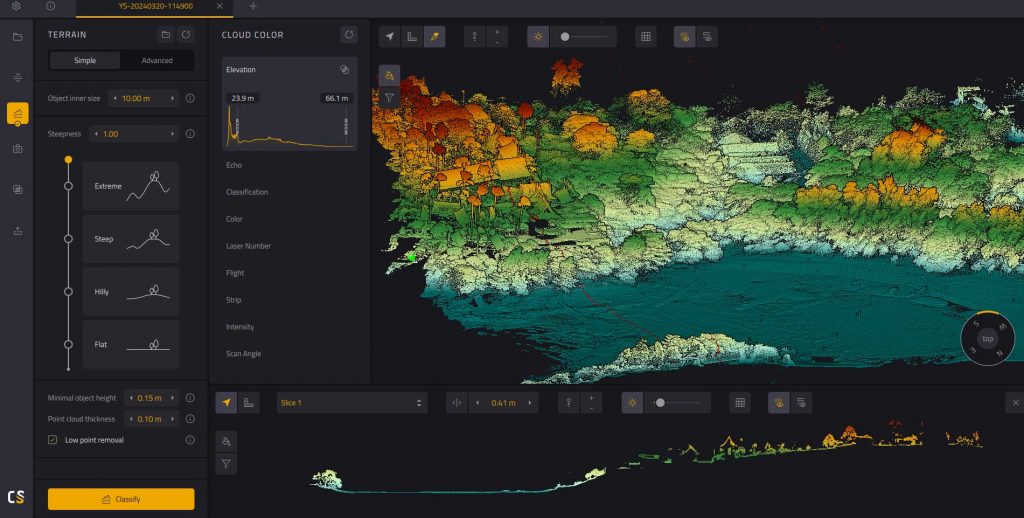
Screenshot from YellowScan CloudStation LiDAR processing software
Frequently Asked Questions
How many points does a LiDAR point cloud contain?
The amount of point clouds in a single point depends on many factors, including point density, accuracy, and the distribution of points within the dataset. The total amount of points per dataset can vary from billions of points to hundreds of thousands of points.
What is the typical area size of a LiDAR point cloud?
There is no fixed area size. This also depends on multiple factors, including the flight altitude in case of an airborne or drone-based system, as well as the specifications of the sensor and the point density. It is possible to scan small areas using drone-based LiDAR and large areas using airborne mapping systems.
Where is a LiDAR point cloud used for?
Common uses are forestry management, archeological studies, geological exploration, as well as topographic mapping, infrastructure modeling, and urban planning and development.
What is the file size of a LiDAR point cloud?
The file size depends on the chosen file type, as well as the survey area, point density, and the number and complexity associated with each point in the point cloud. Depending on these factors, a single file can range from a few megabytes to several terabytes.